Back to Map tool page
Testing the tuscany.sqlite sample database
This quick tutorial explains, by practical step by step examples, how to use the Map Panel tool.The goal is to familiarize yourself with the new Map Panel feature, by repeating each single step shown.
- You need to download the tuscany.sqlite sample database.
- Then you must start spatialite_gui 2.1.0, connecting to this database.
Step #1: displaying Vector and Raster Coverages
| The tuscany.sqlite sample contains the municipalites Vector Coverage that is interesting because it's not based on a Spatial Table but on a Spatial View instad; anyway Spatial Views behave exectly as Spatial Tables, so there is very little to say about this. More interesting is the mixed Vector Coverage, that contains both POINTs, LINESTRINGs and POLYGONs. A Map layer like this one has nothing strange in SpatiaLite; it simply requires a more complex Style supporting three Geometry Classes at the same time. |
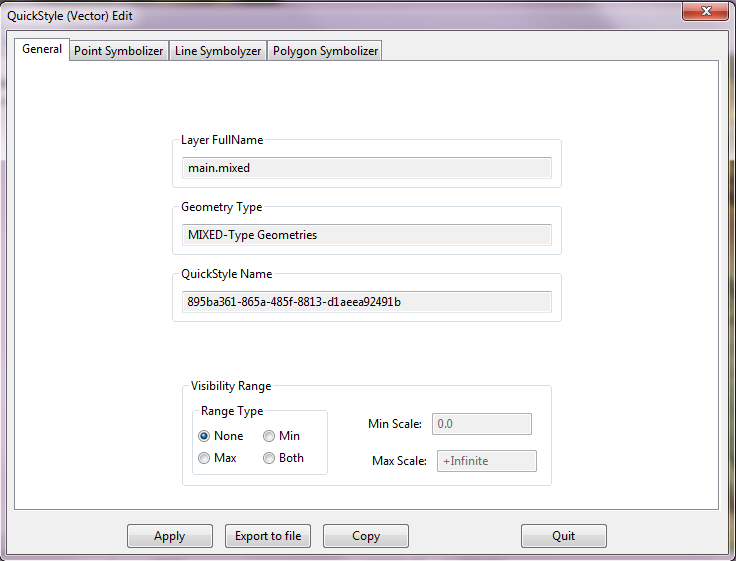 |
| Now you can add to the Map the dtmoro Raster Coverage. Exercise: try by yourself to dispay a Map like the one shown on the side figure |
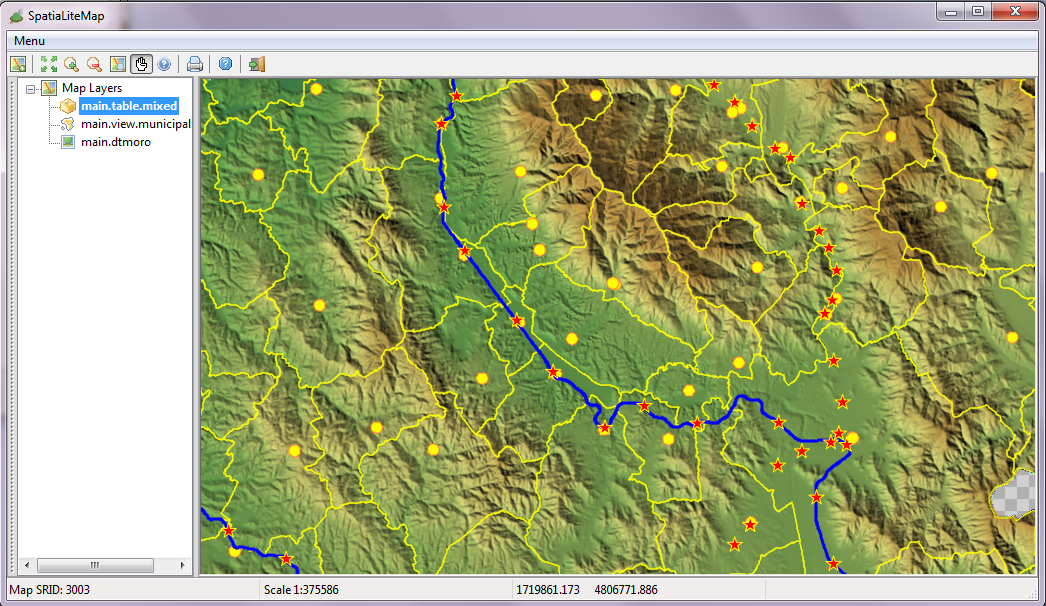 |
Step #2: displaying Vector Coverages over a WMS background
| Add to the Map the OSMGoogle WMS Layer. Exercise: try by yourself to dispay a Map like the one shown on the side figure |
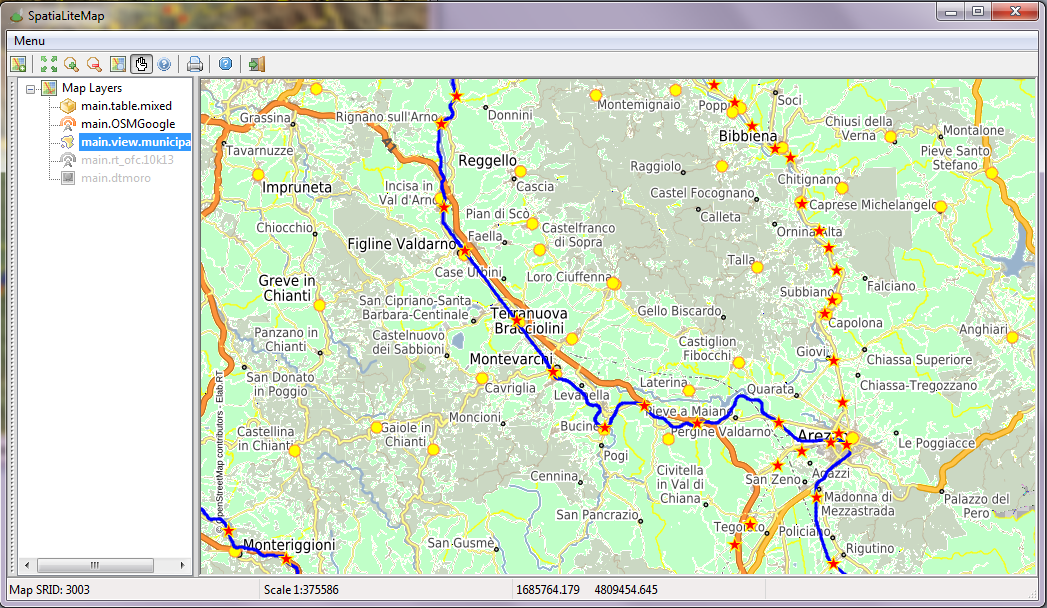 |
| Now add to the Map the rt_ofc_10k13 WMS Layer. Exercise: try by yourself to dispay a Map like the one shown on the side figure |
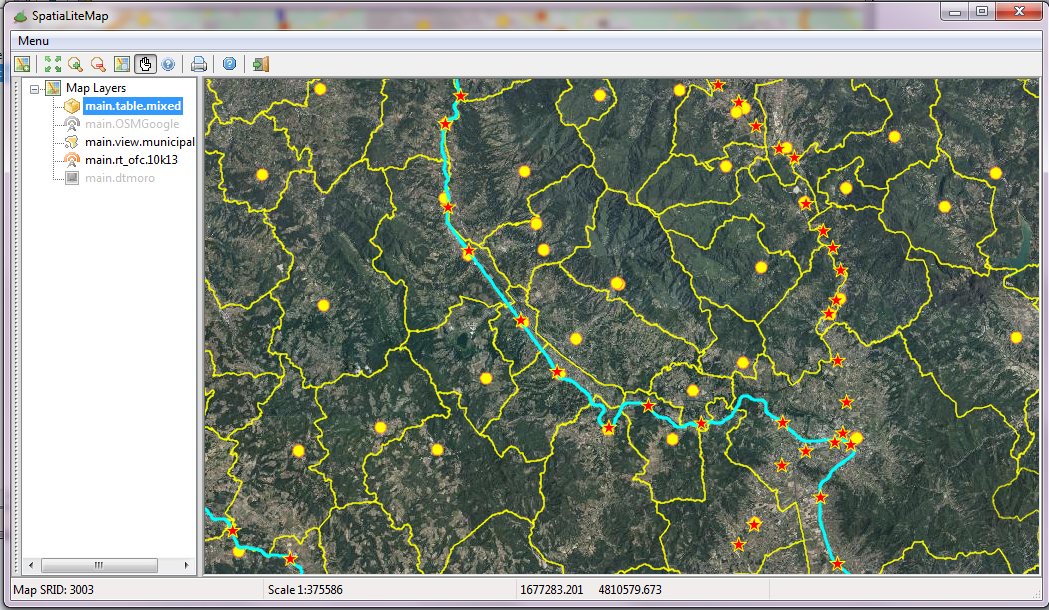 |
Back to Map tool page